.png)
Hidden Wetlands of the Arapaho–Roosevelt National Forests: Techniques for mapping forested wetlands using moderate resolution (5-10m) data sources
By Abby Achtenhagen
When we think of wetlands, we often imagine open water, cattail marshes, or willow-lined streams. But in the Arapaho–Roosevelt National Forest, many wetlands are quieter, subtler, and hidden beneath dense conifer canopy. Mapping these ecologically important systems requires more than a single satellite image. It takes a carefully curated stack of geospatial data layers, each revealing a different part of the wetland story.

Arapaho-Roosevelt National Forest.
The goal: build a forest-wide wetland inventory
The project began with a straightforward but ambitious goal: mapping wetlands across the entire national forest, with a particular focus on mapping the forested wetlands– the ones that are hidden by tree canopy, but no less important for ecological services and environmental planning. The end data layer would be used by the Forest’s timber, wildlife, watershed, fire, and NEPA specialists.
The desired output classes for the map are:
Unconfined meadows
Unclassified wetlands (fens, seeps, forested wetlands)
Water
Traditional wetland mapping
Analysts primarily rely on object-based image analysis (OBIA) to map wetlands. OBIA groups pixels into meaningful segments, which were primarily driven by lidar-derived canopy height model (CHM). The CHM helps isolate open meadows, and NAIP and Sentinel-2 multispectral data help capture the spectral signatures associated with high vegetation productivity and moisture-rich areas.
The challenge of mapping forested wetlands
Mapping meadows was relatively straightforward using the CHM, which quickly separated open vegetation from forested areas. Forested wetlands, however, posed a far greater challenge. The CHM could detect subtle canopy openings that indicated potential wetlands below the forest canopy. But, because from a bird’s eye view, forested wetlands look very similar to surrounding tree vegetation, they were nearly impossible to isolate during segmentation alone.
The solution was to intentionally oversegment the landscape, creating more potential wetland segments than truly existed. Next, we extracted zonal statistics across each segment.
Our final suite of predictor layers included:
NAIP aerial imagery (5m resolution)
Sentinel-2 satellite imagery (10m resolution)
Topographic position indices (5m resolution)
Lidar-derived canopy height models (5m resolution)
Finally, we developed a training data set based on field data, UAS imagery, and local expertise, which we used in Random Forest machine learning models to classify segments into our three target classes.

Example of over segmentation to allow the Random Forest model with training data to sort out the wetlands.

Wetland class (right) refined into unconfined meadows in green and unclassified wetlands in blue.
The final product
Our final output layer mapped wetlands with 90% accuracy across the Arapaho-Roosevelt National Forest, of which about 9% is wetlands.
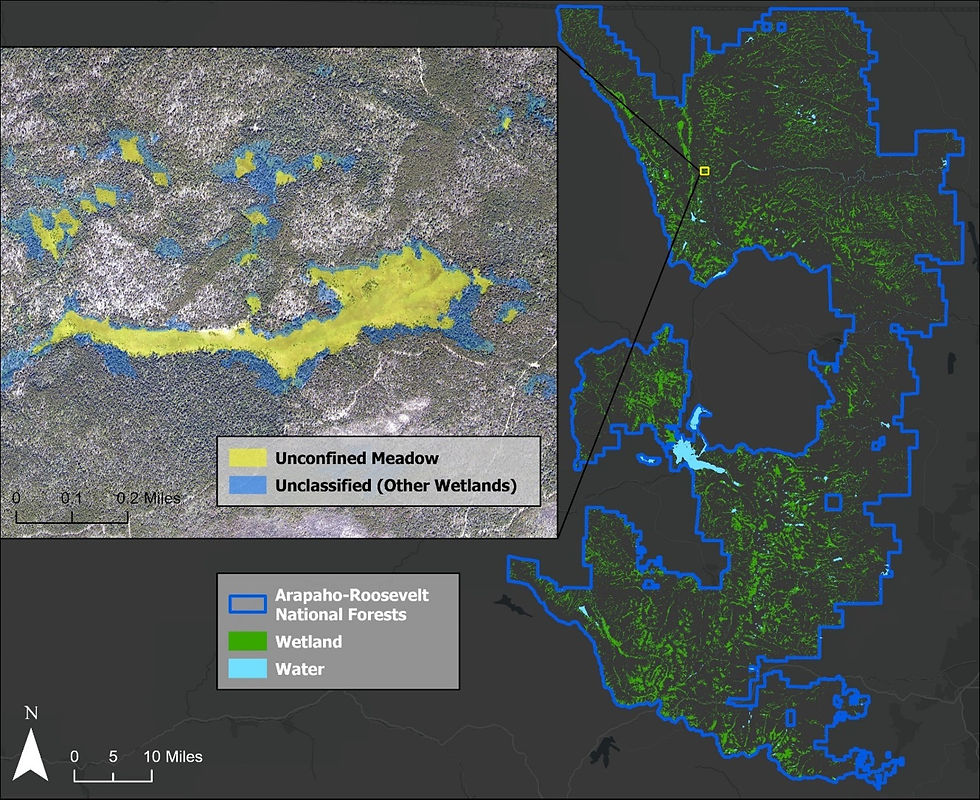
Final map showing the unconfined meadow and unclassified wetlands layers in close-up, and the full extent of the Arapaho National Forest.
Lessons Learned
Through this project, we navigated the challenge of mapping wetlands on a large spatial scale– particularly, devising a method to map forested wetlands that are not as visible from satellite and aerial imagery. We also found that the AlphaEarth Foundations embeddings improved our classification, but were not adequate on their own to predict the presence of wetlands– our classification needed NAIP, Sentinel-2 and lidar derivatives to accurately predict our wetland classes.
The Option for Further Classification
The inventory accurately identifies where wetlands occur, but the unclassified wetlands category still combines several distinct forested wetland types—such as seeps, fens, and other groundwater-fed systems.
In order to classify these specific wetland types, we will require higher resolution lidar or UAS data, targeted field sampling, and additional moisture and structure-based predictors. Specific bands from the AlphaEarth Foundations embeddings dataset may also help distinguish these wetland classes, but we will need to perform variable selection on these data in order to better evaluate them.


Comments